Viewing tracks
Open files
Open D4 replaces tracks and annotation; Add D4 appends tracks. Both accept multiple files and load every track in each D4. An invalid file or cancelled load leaves the current view in place.
Tracks may contain different chromosomes. If a chromosome appears in several tracks, its length must match. D4 metadata cannot confirm the reference assembly; check it before comparing samples. Also check filtering and normalization: D4 Plot does not normalize tracks automatically.
Read the signal
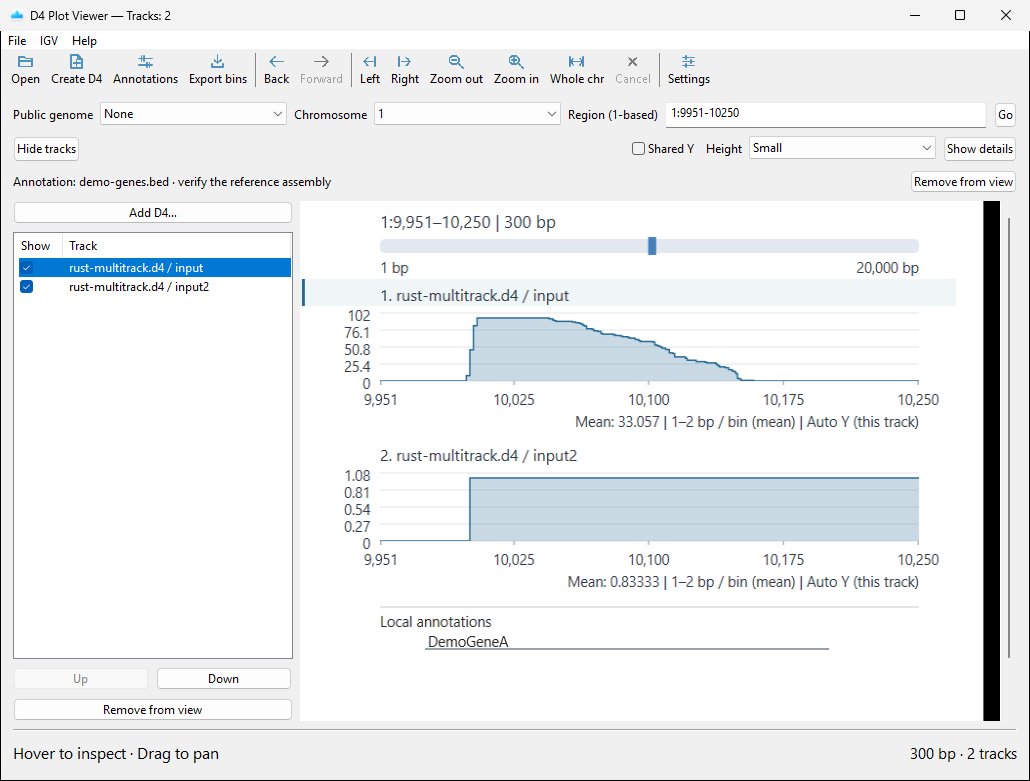
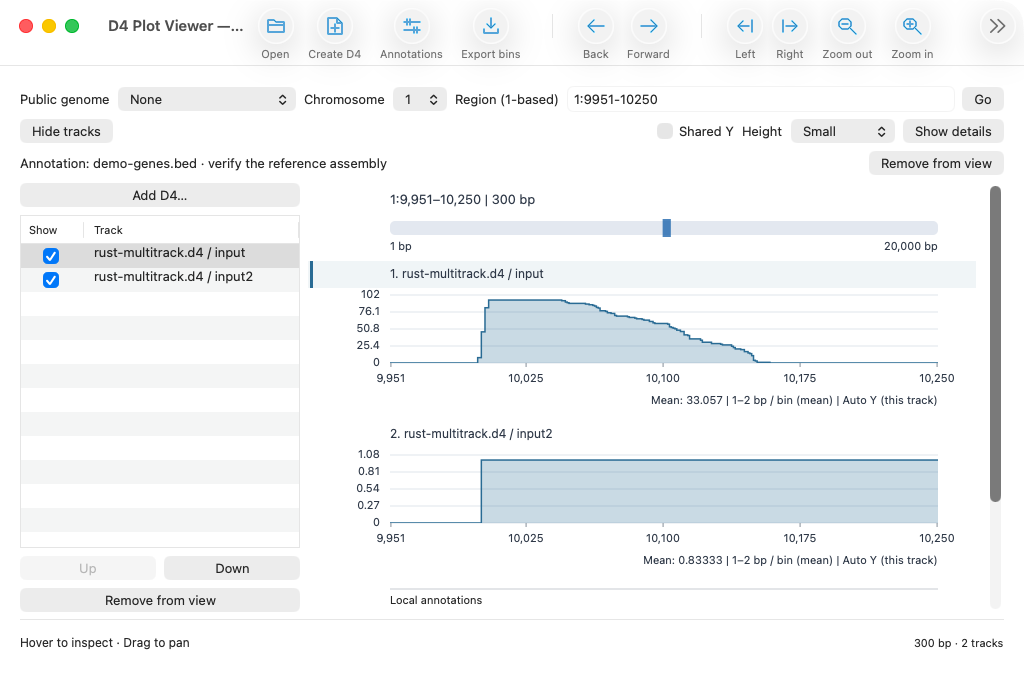
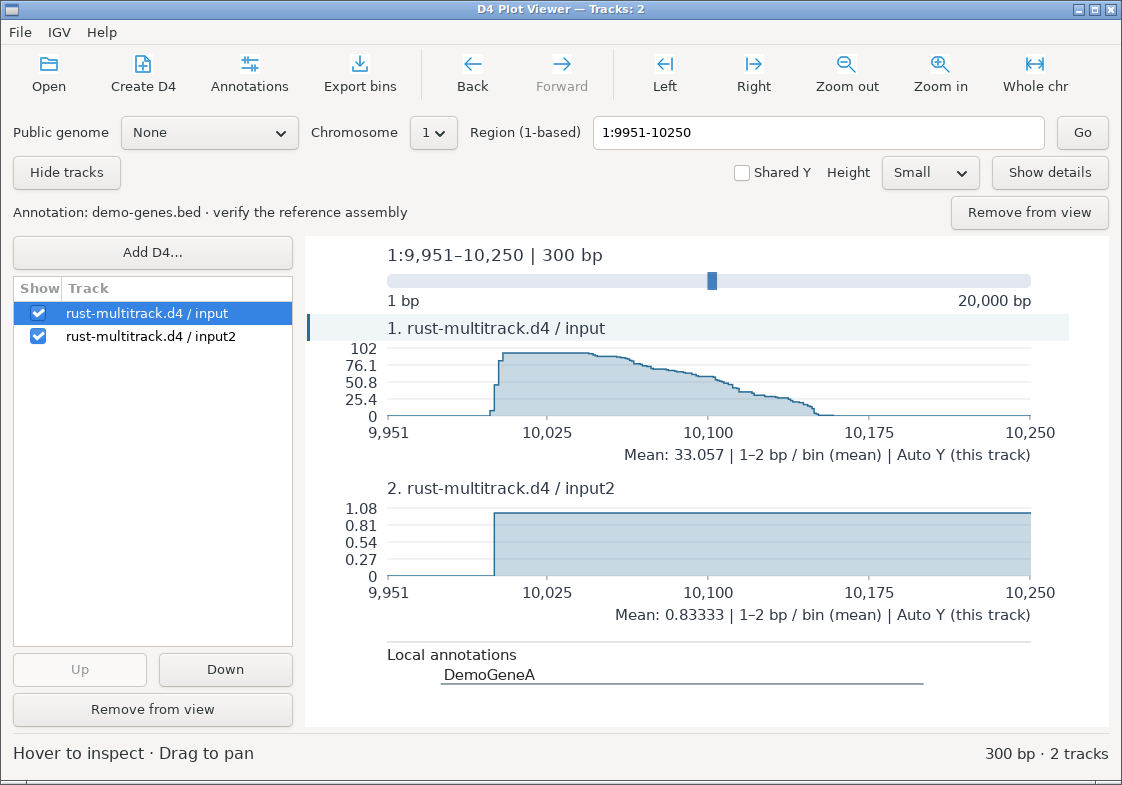
The plot shows bin means. Wider views combine more bases per bin, so narrow peaks may change height or width as you zoom.
Use Shared Y to compare heights. Use separate automatic scales to compare shapes, or a fixed Y range across regions.
| Windows | macOS | Linux |
|---|---|---|
 |
 |
 |
Navigate
The region field accepts chr1:100-200, chr1:100, or chr1. Coordinates are 1-based and inclusive.
| Action | Result |
|---|---|
| Drag | Pan |
| Shift-drag or right-drag | Select range |
| Double-click / right-double-click | Zoom in / out |
| Wheel up / down over the plot | Zoom in / out around the pointer |
| Click outside the chromosome overview's highlighted range | Recenter |
| Back / Forward | Move through history |
| Left / Right, with plot focus | Pan half a view |
+ / -, Home, Escape |
Zoom, show chromosome, cancel load or drag |
Use the wheel over plot margins or the native scrollbar to scroll vertically through tracks.
Select tracks by title or in the track list. The list can show, hide, reorder, or remove tracks without deleting files. Height changes row height; hiding the sidebar gives the plot more room. Settings controls bin count, Y scale, reference lines, colors, annotation limit, and toolbar labels.
See IGV integration for other genome tracks.